The 2024 Health Equity Index (formerly SocioNeeds Index), created by Conduent Healthy Communities Institute, is a measure of socioeconomic need that is correlated with poor health outcomes. The index is part of Conduent's SocioNeeds Index® Suite, which provides analytics around social determinants of health to advance equitable outcomes for a range of topics.
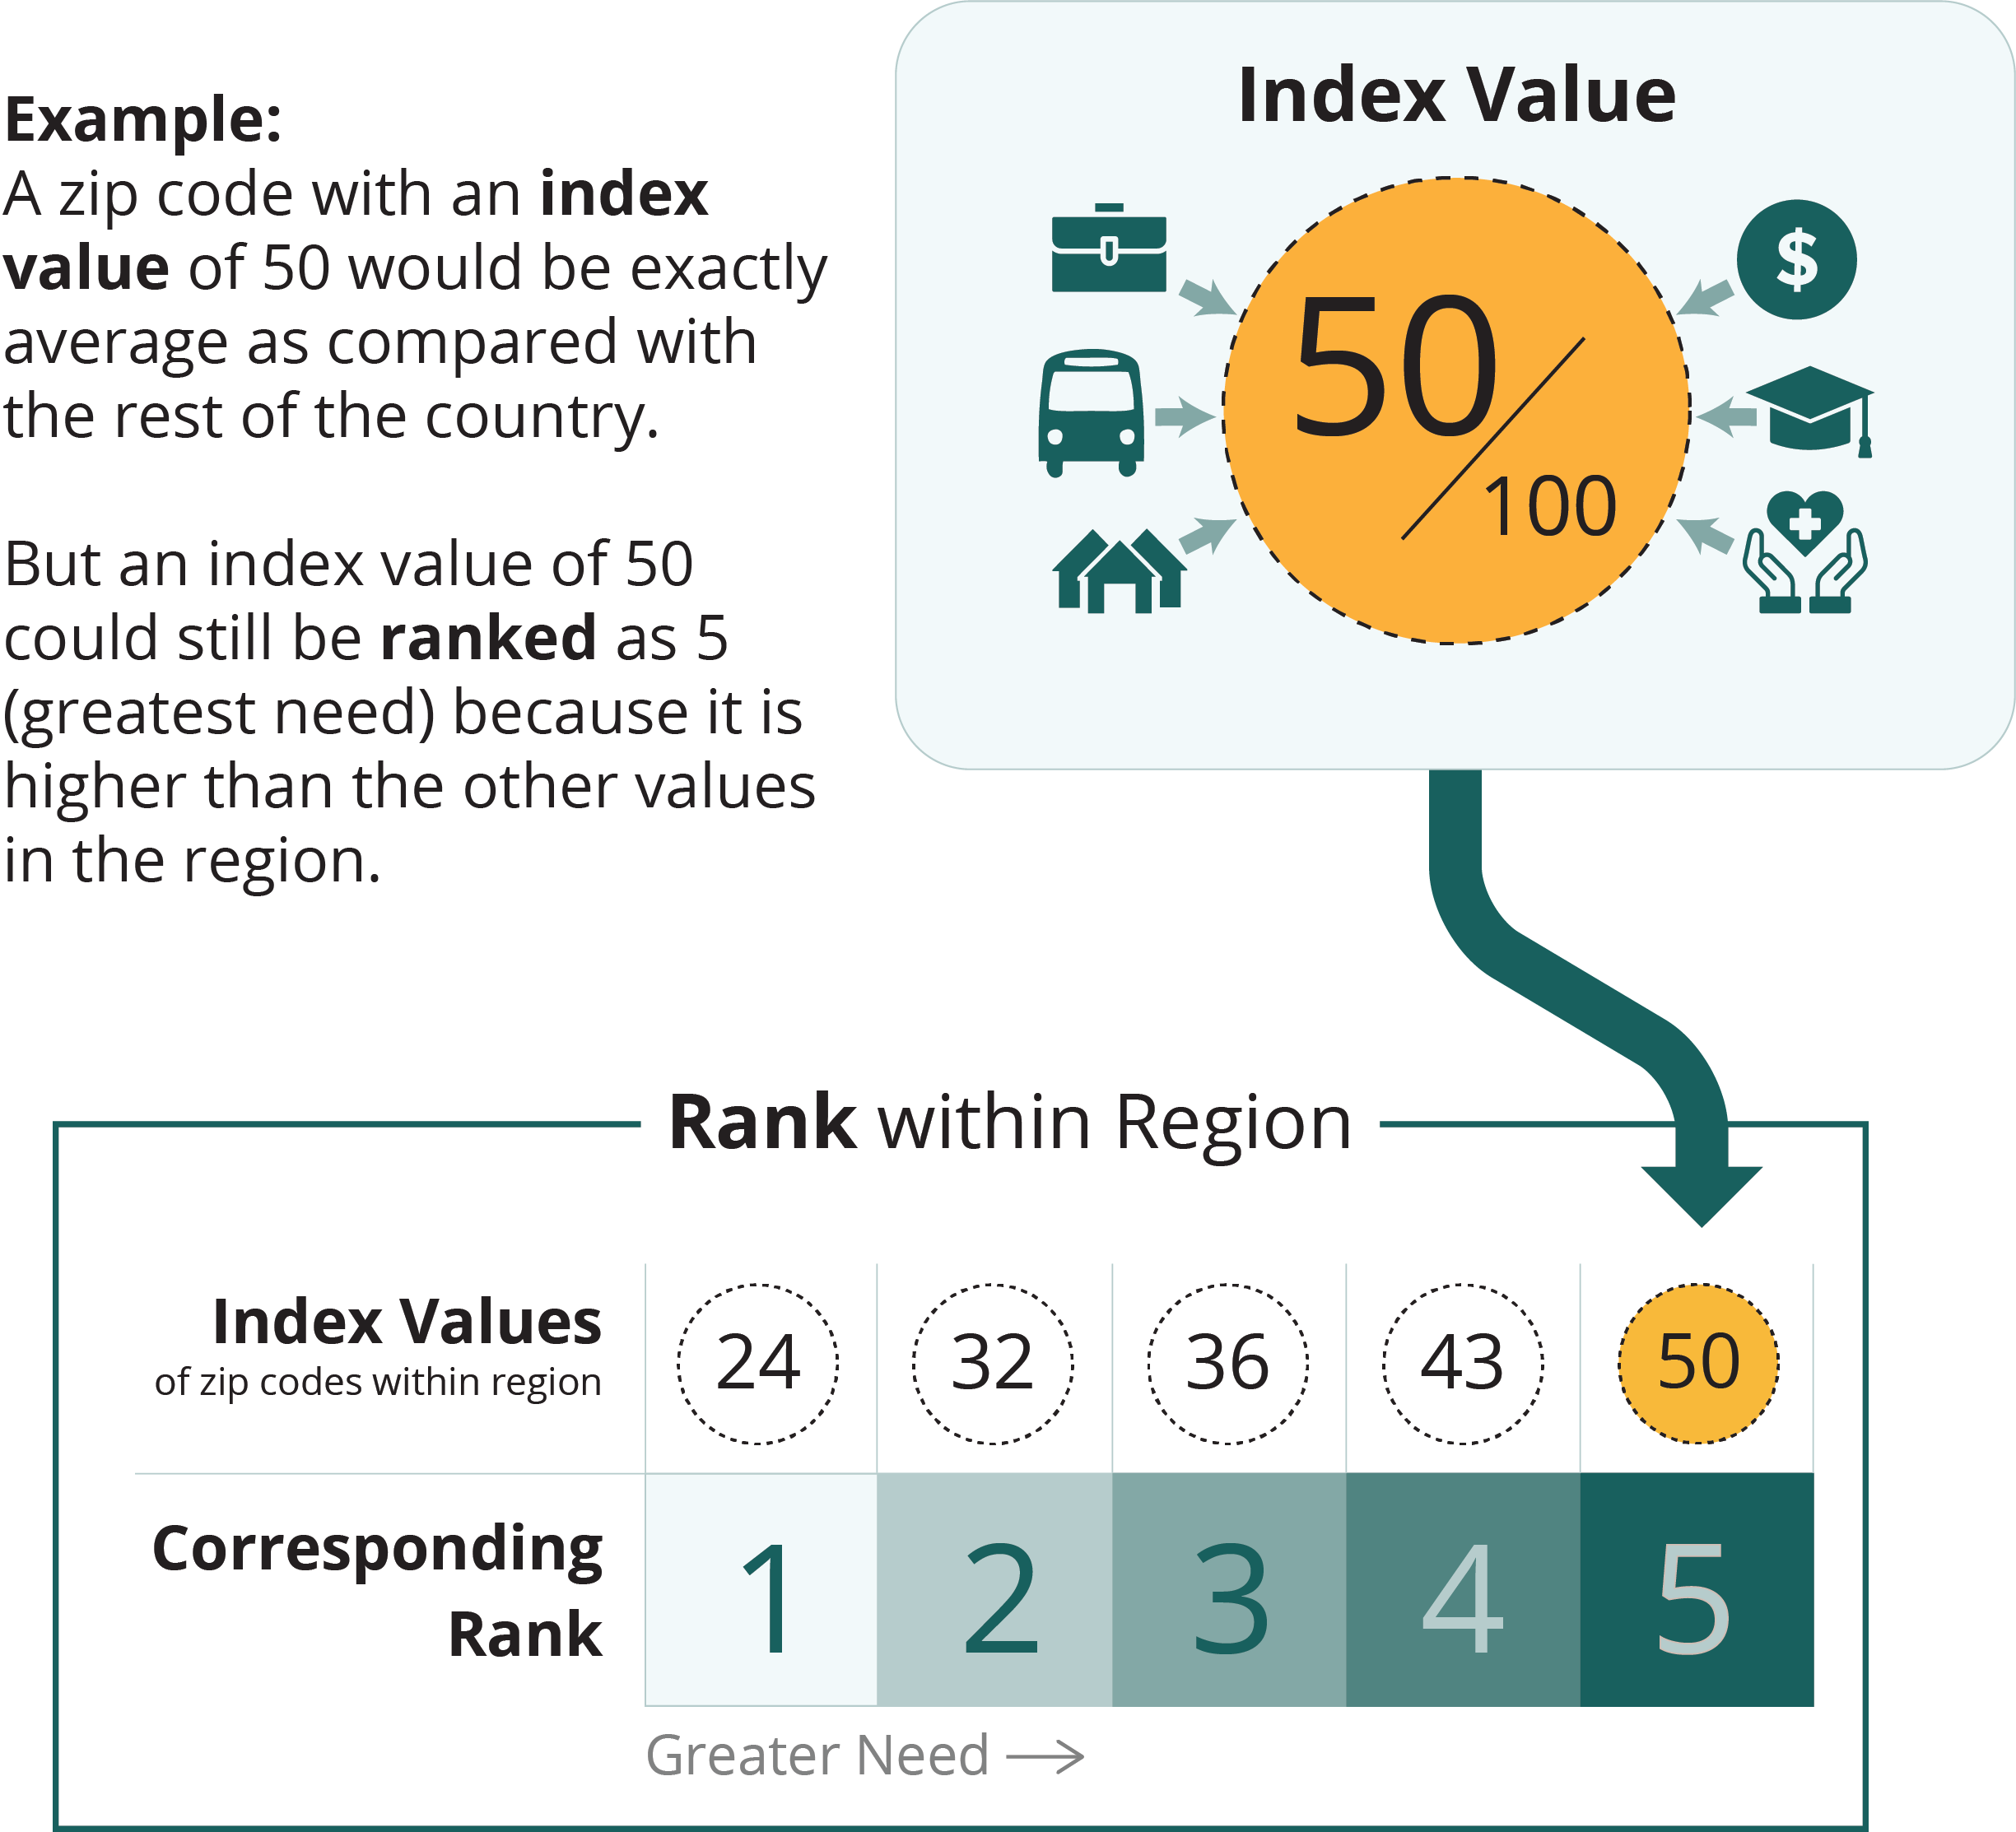
All zip codes, counties, and county equivalents in the United States are given an index value from 0 (low need) to 100 (high need). To help you find the areas of highest need in your community, the selected locations are ranked from 1 (low need) to 5 (high need) based on their index value relative to similar locations within the region.

map legend
greater need
1
2
3
4
5


| Zip Codesort column | Indexsort column | Ranksort column | Pop.sort column | Countysort column |
|---|---|---|---|---|
| 20019 | 94.8 | 5 | 57,324 | Prince George's |
| 20783 | 91.2 | 5 | 47,791 | Prince George's |
| 20737 | 86.2 | 5 | 24,401 | Prince George's |
| 20722 | 72.1 | 4 | 6,698 | Prince George's |
| 20710 | 66.5 | 4 | 9,800 | Prince George's |
| 20784 | 61.4 | 4 | 30,020 | Prince George's |
| 20706 | 48.2 | 3 | 45,318 | Prince George's |
| 20781 | 46.4 | 3 | 13,867 | Prince George's |
| 20785 | 45.6 | 3 | 41,069 | Prince George's |
| 20770 | 44.9 | 3 | 27,358 | Prince George's |
| 20705 | 42.1 | 3 | 30,522 | Prince George's |
| 20712 | 41.8 | 3 | 8,973 | Prince George's |
| 20740 | 41.5 | 3 | 34,105 | Prince George's |
| 20724 | 37.2 | 3 | 19,953 | Prince George's |
| 20782 | 35.0 | 3 | 34,893 | Prince George's |
| 20743 | 33.2 | 3 | 39,610 | Prince George's |
| 20745 | 30.9 | 3 | 32,258 | Prince George's |
| 20748 | 23.2 | 2 | 36,550 | Prince George's |
| 20747 | 19.4 | 2 | 38,962 | Prince George's |
| 20707 | 14.1 | 2 | 37,437 | Prince George's |
| 20904 | 14.1 | 2 | 58,335 | Prince George's |
| 20762 | 12.8 | 2 | 3,052 | Prince George's |
| 20608 | 12.1 | 2 | 790 | Prince George's |
| 20708 | 9.4 | 1 | 26,939 | Prince George's |
| 20769 | 8.3 | 1 | 7,182 | Prince George's |
| 20742 | 8.1 | 1 | 8,124 | Prince George's |
| 20602 | 7.9 | 1 | 29,914 | Prince George's |
| 20744 | 7.4 | 1 | 52,183 | Prince George's |
| 20601 | 6.9 | 1 | 28,933 | Prince George's |
| 20866 | 5.7 | 1 | 15,099 | Prince George's |
| 20607 | 5.2 | 1 | 12,816 | Prince George's |
| 20774 | 5.2 | 1 | 52,123 | Prince George's |
| 20746 | 4.8 | 1 | 30,898 | Prince George's |
| 20715 | 4.4 | 1 | 25,969 | Prince George's |
| 20735 | 4.0 | 1 | 37,843 | Prince George's |
| 20716 | 3.9 | 1 | 22,351 | Prince George's |
| 20613 | 3.1 | 1 | 15,905 | Prince George's |
| 20772 | 2.3 | 1 | 51,643 | Prince George's |
| 20623 | 2.2 | 1 | 2,689 | Prince George's |
| 20723 | 1.3 | 1 | 35,410 | Prince George's |
| 20720 | 1.2 | 1 | 25,265 | Prince George's |
| 20721 | 0.8 | 1 | 29,330 | Prince George's |
Data Source
The Health Equity Index is calculated by Conduent Healthy Communities Institute using data from Claritas Pop-Facts®, 2024 and Claritas Consumer Profiles, 2023.
Technical Note
Index values are not comparable across measurement periods. Index values and rankings are specific to a measurement period, showing the relative ranking of a location in comparison to other similar locations at that time.